Websites as graphs
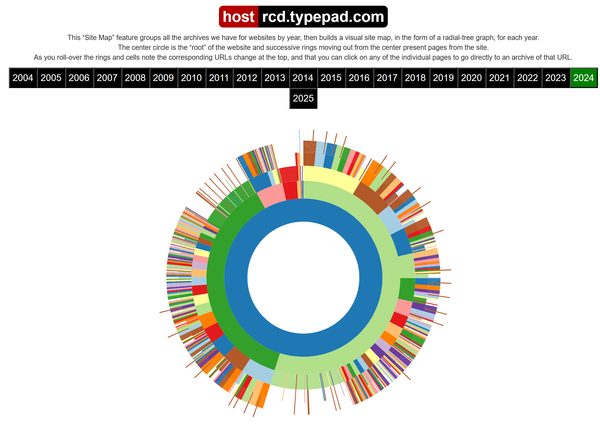
This is a graphical map of my blogs structure generated by: Websites as graphs - an HTML DOM Visualizer Applet See this image grow with Jing: http://www.screencast.com/t/toiKtZiWw
This is a graphical map of my blogs structure generated by:
Websites as graphs - an HTML DOM Visualizer Applet

Websites as graphs - an HTML DOM Visualizer Applet

See this image grow at Websites as graphs
See this image grow at Websites as graphs
See this image growing captured with Jing.
See this image growing captured with Jing.
What do the colours mean?
blue: for links (the A tag)
red: for tables (TABLE, TR and TD tags)
green: for the DIV tag
violet: for images (the IMG tag)
yellow: for forms (FORM, INPUT, TEXTAREA, SELECT and OPTION tags)
orange: for linebreaks and blockquotes (BR, P, and BLOCKQUOTE tags)
black: the HTML tag, the root node
gray: all other tags
What do the colours mean?
blue: for links (the A tag)
red: for tables (TABLE, TR and TD tags)
green: for the DIV tag
violet: for images (the IMG tag)
yellow: for forms (FORM, INPUT, TEXTAREA, SELECT and OPTION tags)
orange: for linebreaks and blockquotes (BR, P, and BLOCKQUOTE tags)
black: the HTML tag, the root node
gray: all other tags Tags: Jing


